
1. Customer retention rate
Customer retention rate measures the percentage of existing customers your business retained over a given period. To calculate customer retention rate, take the total number of customers at the end of a period and subtract the total number of new customers. Divide that number by the total number of customers at the start of the time period and multiply by 100 to get your retention rate.
Customer retention rate (CRR) =
[(Total customers – New customers) / Customers at start of time period] x 100
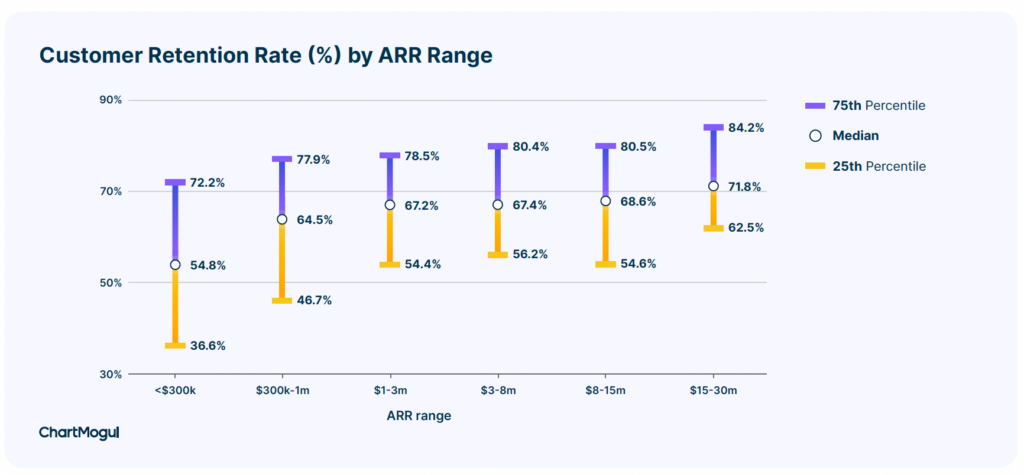
Here is an interesting chart from ChartMogul that show customer retention rate by annual recurring revenue (ARR). This shows that customer retention is low at the beginning of a customer relationship when the company is building a SaaS business – ranging from 37 percent to 72 percent. However, retention improves as annual revenues increase, reaching a high of 85 percent.
To increase customer retention rate, consider the following strategies:
- Train your sales and front line staff on how to to address customer concerns promptly and effectively.
- Build strong relationships by rewarding long-time or frequent customers and creating a customer success team.
- Address customer complaints and issues promptly and professionally.
- Monitor customer feedback and make necessary improvements based on customer support tickets and suggestions.
- Stay in touch with clients by sending regular updates, newsletters, and relevant content to keep customers engaged.
2. Customer churn rate
Customer churn rate, or customer turnover rate, is the number of customers you lost during a time period. To calculate the churn rate, take the number of lost customers and divide by the total number of customers (T) at the start of the time period (TP). Multiply by 100 to get your customer churn rate percentage.
Customer churn rate =
(Number of lost customers / Total number of customers) x 100
A good SaaS churn rate benchmark falls between 5 to 7 percent for annual churn and less than 1 percent for monthly churn. But a SaaS Capital report found that as the company grows, the churn rates increased and was as high as 13 percent for companies with over $20 million in revenues.
Reasons why customer churn may be high include not monitoring customer usage and behaviour, poor customer support, a competitive landscape, pricing, low ROI, onboarding issues and inadequate product features.
Given these factors, ways to address high customer rate include investing in a customer success team, continuously train customer support teams on product issues and new features, adding new features based on customer feedback, providing a comprehensive customer onboarding program, offering rewards, incentives and discounts, demonstrating the value of the product and having a clear product roadmap that you communicate and follow through on.
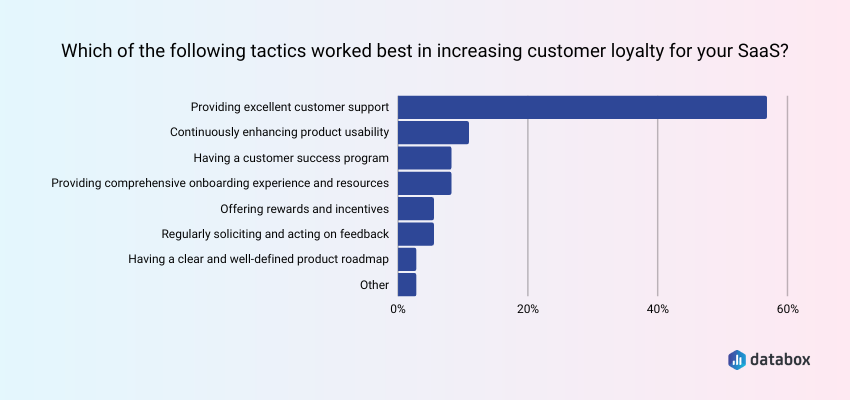
Below is a chart from Databox that shows tactics used by SaaS companies to increase customer loyalty.
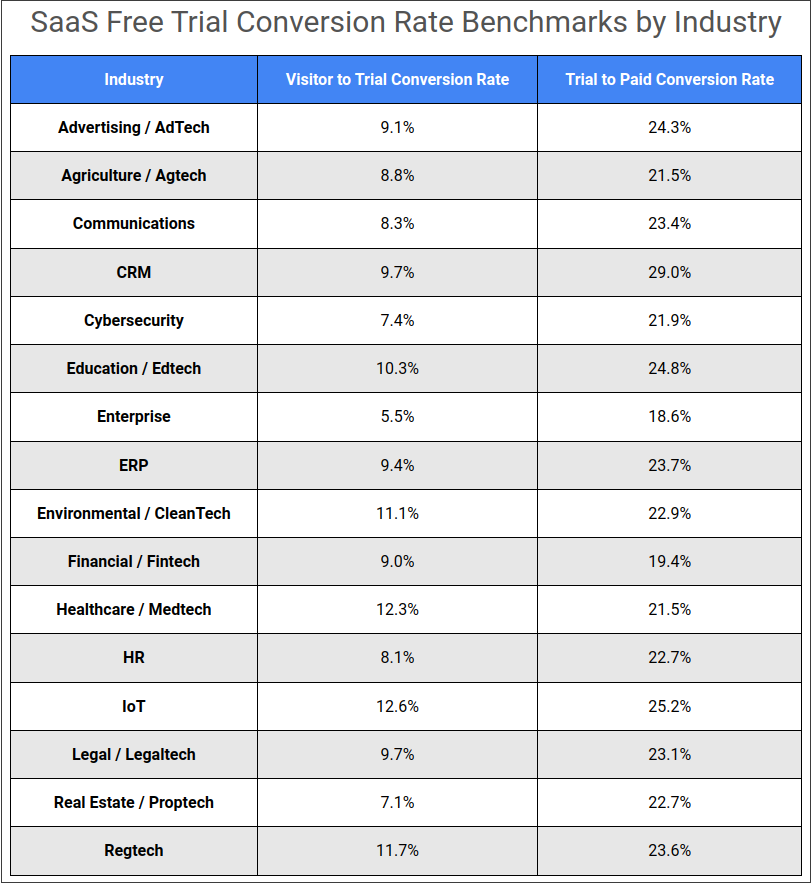
5. Trial conversion rate
The trial-to-paid conversion rate is the number of customers who convert their free or trial accounts into paid accounts. It is measured by the number of clients who convert into paid accounts divided by the total number of trial accounts in a specified time period. Multiply by 100 to get your percentage.
Trial conversion rate =
[Number of customers who convert to paid accounts / Number of trial users] * 100
With opt-in trials, where users gain access to the full product without giving their payment information, Useproof reports an industry benchmark of 25 percent free trial to conversion rate. For opt-out trials, where users gain access to the full product by giving their payment information upfront, Klipfolio reports an average conversion rate of 60 percent.
- Guiding clients through key features and benefits during their initial interactions
- Making essential or popular features available only in the paid version, but ensure trial users get a teaser or limited access to understand their value
- Offering training, tutorials, and webinars to help trial users understand and make the most of the trial
- Using targeted, timely in-app messages or email notifications to highlight premium features, provide tips, or share success stories and
- Providing special discounts or promotions to incentivize users to convert before their trial ends
- Sharing success stories, testimonials, user logos, customer count and user reviews as social proof to build trust and highlight the value of your offering
- Providing quality customer support during the trial period
- Ensuring users understand the unique value and benefits in paid versions
- Extending trial period for engaged users who need extra time they need to decide
- Ensuring the move to paid plan is simple and seamless, without unnecessary steps or data loss.