Customer success metrics are a great way to measure the performance of your customer success teams, highlight what is working well and pinpoint areas that need a little extra attention.
So, what are some common customer success metrics? In this blog, we highlight twelve customer success metrics to measure things like retention rate, referral rate and levels of satisfaction. We hope you can use these to help guide your customer success strategy, plan your tactics, coordinate resources, and mostly importantly, increase customer satisfaction.
1. Customer retention rate
Customer retention rate measures the percentage of existing customers your business retained over a given period. To calculate customer retention rate, take the total number of customers at the end of a period and subtract the total number of new customers. Divide that number by the total number of customers at the start of the time period and multiply by 100 to get your retention rate.
Customer retention rate (CRR) =
[(Total customers – New customers) / Customers at start of time period] x 100
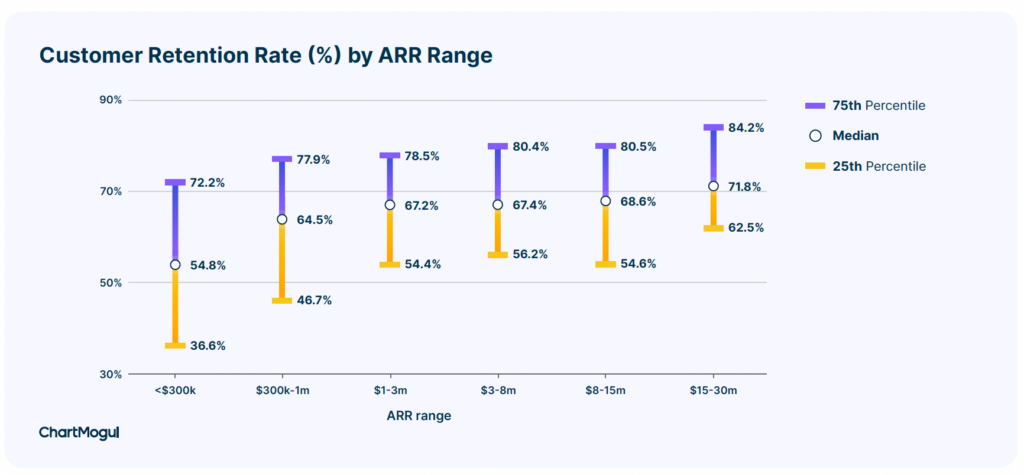
Here is an interesting chart from ChartMogul that show customer retention rate by annual recurring revenue (ARR). This shows that customer retention is low at the beginning of a customer relationship when the company is building a SaaS business – ranging from 37 percent to 72 percent. However, retention improves as annual revenues increase, reaching a high of 85 percent.

To increase customer retention rate, consider the following strategies:
- Train your sales and front line staff on how to to address customer concerns promptly and effectively.
- Build strong relationships by rewarding long-time or frequent customers and creating a customer success team.
- Address customer complaints and issues promptly and professionally.
- Monitor customer feedback and make necessary improvements based on customer support tickets and suggestions.
- Stay in touch with clients by sending regular updates, newsletters, and relevant content to keep customers engaged.
2. Customer churn rate
Customer churn rate, or customer turnover rate, is the number of customers you lost during a time period. To calculate the churn rate, take the number of lost customers and divide by the total number of customers (T) at the start of the time period (TP). Multiply by 100 to get your customer churn rate percentage.
Customer churn rate =
(Number of lost customers / Total number of customers) x 100
A good SaaS churn rate benchmark falls between 5 to 7 percent for annual churn and less than 1 percent for monthly churn. But a SaaS Capital report found that as the company grows, the churn rates increased and was as high as 13 percent for companies with over $20 million in revenues.
Reasons why customer churn may be high include not monitoring customer usage and behaviour, poor customer support, a competitive landscape, pricing, low ROI, onboarding issues and inadequate product features.
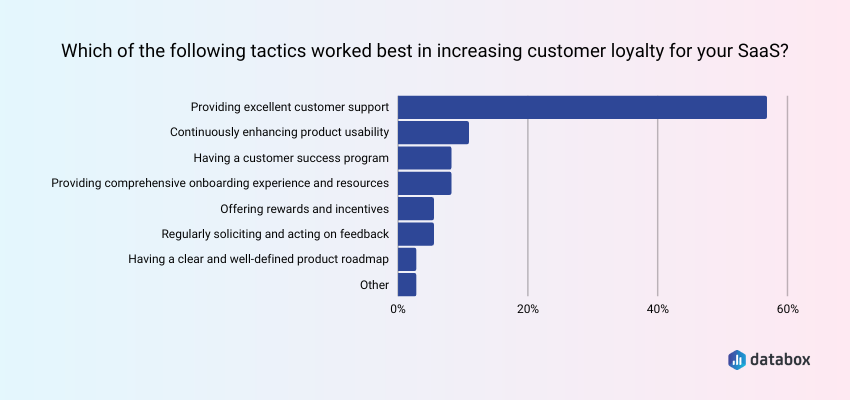
Given these factors, ways to address high customer rate include investing in a customer success team, continuously train customer support teams on product issues and new features, adding new features based on customer feedback, providing a comprehensive customer onboarding program, offering rewards, incentives and discounts, demonstrating the value of the product and having a clear product roadmap that you communicate and follow through on.
Below is a chart from Databox that shows tactics used by SaaS companies to increase customer loyalty.
3. Customer retention cost
Customer retention costs are all the costs to maintain and support a customer and includes things like costs related to customer service, providing training/tutorials, administering customer loyalty programs, and maintaining account management teams. Calculating customer retention costs can be tricky because it requires separating customer retention costs from customer acquisition costs.
To calculate customer retention costs, take total retention costs for all customers and divide by the number of active customers in that period.
Average Customer Retention Costs (CRC) =
Total retention costs / Number of active customers
To reduce customer retention costs, consider using the following strategies.
- Improve the onboarding experience as a good introduction to your product and service will reduce the burden on customer support resources through the life of product. Consider segmenting your customers by role and goals and build a targeted onboarding experience, rather than a one size fits all approach.
- Build self-guided walkthroughs that allow clients to tour the product on their own. You can use these walkthroughs (or learning paths) as precursors to the onboarding process, during onboarding and during the life of the product. To make the walkthroughs effective, consider using microlearning that focuses on a teaching a single concept, using your customer support tickets to identify areas that need to be addressed and build walkthroughs for both beginners and power users.
- Fix product bugs to reduce customer support costs.
- Introduce enhancements and new features that make your product more intuitive and easier to use – for example, work with UI/UX designer if people are struggling to navigate your SaaS product. This will reduce customer support costs and increase customer retention.
- Use data analytics to analyze user behaviour to mark where clients drop off or stop using the product.
4. Customer lifetime value
Customer lifetime value (also known as lifetime value (LTV)) is the total revenue your business can expect to make from a customer during their lifetime as a paying customer. To calculate customer lifetime value, multiply the customers’ average purchase value, average purchase frequency, and average customer lifespan.
Customer lifetime value (CLV) =
Average purchase value * Average purchase frequency * Average customer lifespan
Average purchase value (APV) is calculated by taking the total revenue earned in a specific period and dividing it by the total number of sales generated during that same period. Average purchase frequency (APF) is calculated by dividing the number of sales made by the number of unique customers in a time period. Average customer lifespan (ACL) is calculated by adding all customer lifespans and dividing by the total number of customers.
Strategies to increase lifetime value include:
- Enhance product quality and product offering to increase customer loyalty and more repeat purchases.
- Focus on customer service that aims to reduce churn and provide a positive experience at every touchpoint, from pre-sales inquiries to post-purchase support. Regularly engage with customers via training, tutorials, workshops, forums, user groups, communities, newsletters, social media, or events.
- Reward loyal clients by providing product discounts, exclusive offers and early access to sales, or special promotions. Also consider implementing rewards or loyalty programs can incentivize repeat purchases.
- Upsell and cross-sell by recommending complementary products, premium versions of items or bulk discounts to increase the average transaction value.
- Solicit and act on customer feedback to enhance satisfaction and loyalty.
5. Trial conversion rate
The trial-to-paid conversion rate is the number of customers who convert their free or trial accounts into paid accounts. It is measured by the number of clients who convert into paid accounts divided by the total number of trial accounts in a specified time period. Multiply by 100 to get your percentage.
Trial conversion rate =
[Number of customers who convert to paid accounts / Number of trial users] * 100
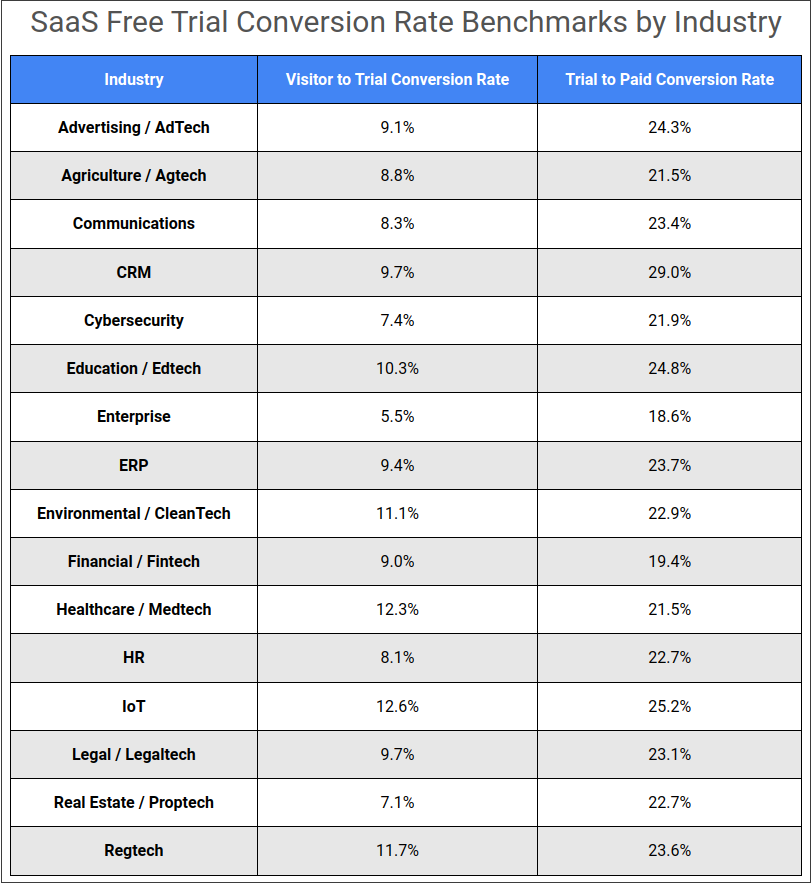
With opt-in trials, where users gain access to the full product without giving their payment information, Useproof reports an industry benchmark of 25 percent free trial to conversion rate. For opt-out trials, where users gain access to the full product by giving their payment information upfront, Klipfolio reports an average conversion rate of 60 percent.
- Guiding clients through key features and benefits during their initial interactions
- Making essential or popular features available only in the paid version, but ensure trial users get a teaser or limited access to understand their value
- Offering training, tutorials, and webinars to help trial users understand and make the most of the trial
- Using targeted, timely in-app messages or email notifications to highlight premium features, provide tips, or share success stories and
- Providing special discounts or promotions to incentivize users to convert before their trial ends
- Sharing success stories, testimonials, user logos, customer count and user reviews as social proof to build trust and highlight the value of your offering
- Providing quality customer support during the trial period
- Ensuring users understand the unique value and benefits in paid versions
- Extending trial period for engaged users who need extra time they need to decide
- Ensuring the move to paid plan is simple and seamless, without unnecessary steps or data loss.
6. Monthly recurring revenue (MRR)
Monthly recurring revenue is one way to measure a business’ stable and predictable monthly revenue. It is calculated by multiplying the average monthly revenue per customer by the total number of customers. The revenue should include all recurring charges such as coupons, discounts, and repeated add-ons, but not include one-time fees.
Monthly recurring revenue =
[Average monthly revenue per customer] * [Total number of customers]
MRR is a common indicator of the growth of some businesses (examples: SaaS and subscription). Tracking MRR over time can show month-over-month growth, stagnation or decline. Since recurring revenue is key for any SaaS, MRR can show how successful or not successful the business is.
A KeyBanc 2019 SaaS Survey found the average annual MRR Growth Rate across all companies surveyed was 52 percent. However, an analysis by Klipfolio found that annual MRR growth rate by ARR was much higher for companies with small ARR compared to those with higher ARR.
7. Product adoption rate (PAR)
Product adoption rate can be used to measure product, feature or service adoption in a given time period. It is calculated by dividing the total number of customers who used the product, feature or service by the total number of customers. Both the usage and total number of customers must be in the same time period for this metric to have value.
Product adoption rate =
[Customers who used product] / [Total number of customers] x 100
Knowing the product adoption rate can identify products, features, or services suffering from adoption friction.
8. Daily active users (DAU)
Daily active users is a measurement of how sticky a product is and customer engagement with the product. Higher usage suggests your customers are getting more value from the product which leads to business benefits. It is calculated by dividing the total active sessions by the number of days in the time period of interest. A good average could be produced by dividing total monthly active sessions by the number of days in that month.
Daily average users =
[Total active sessions] / [Days in that time period]
Active user sessions will differ from product to product, and might consist of a single user interaction, or a series of user actions. Businesses need to decide which measure fits their product and apply it appropriately.
9. Net promoter score (NPS)
Net promoter score is a measurement of customer feedback. It is calculated by subtracting the total number of detractors from the number of promoters. Questions such as: “How likely are you to recommend this product to someone else?” measured on a scale from 1 – 10 will produce some detractors (0 – 6), some promoters (9 – 10) and some neutrals (7 – 8).
Net promoter score =
[% of promoters] / [% of detractors]
NPS can be used to assess customer loyalty, satisfaction and enthusiasm for a product or business. An NPS score above 20 is great and a score above 50 is really good. But a recent Retently study found that average NPS scores can vary by industry. Here are the average NPS scores (2023) they found:
- Consulting: 68
- Technology & Services: 61
- Digital Marketing Agency: 60
- Construction: 45
- Logistics & Transportation: 43
- B2b Software & SaaS: 40
- Cloud & Hosting: 25
- Insurance: 71
- E-commerce: 62
- Retail: 61
- Financial Services: 56
- Healthcare: 38
- Communications & Media: 29
10. Customer satisfaction score (CSAT score)
Sometimes referred to as CSAT score, the Customer satisfaction score is a customer experience metric based on feedback. It is measured by how customers rate their experience with your product, feature, service or company. Information is gathered through customer satisfaction surveys asking questions such as: “How satisfied were you with …?” Each business can assess customer satisfaction with their own weighting of enthusiastic or positive responses over total number of responses. One example of such a weighting is below:
CSAT score =
[Number of positive responses] / [Total number of responses] * 100
One strength pf CSAT score is simplicity. It is an easy way to assess customer interaction success or failure and can be tracked to overall customer satisfaction over time.
Retently states that a CSAT score below 50 speaks of poor customer satisfaction. A score above 70 is good or excellent. As in NPS scores, CSAT scores can vary by industry. Here are the average CSAT scores by industry (2022):
- Consulting: 85
- Healthcare: 79
- eCommerce & Retail: 74
- Digital Marketing Agency: 67
- B2B Software & SaaS: 65
- Education: 47
- Consumer Services: 20
- Communications & Media: 16
11. First contact resolution rate (FCR)
First contact resolution rate can be used to monitor and increase your customer success team’s efficiency and improving your customer’s experience. It is calculated by dividing the number of issues resolved on first contact by the total number of issues.
First contact resolution rate =
[Issues resolved on first contact] / [Total number of issues] * 100
If your customer’s requests or questions can be resolved on the first contact, it removes the need for agent or customer follow-up, and results in more satisfied customers. Your business benefits with reduced effort and your customer benefits with reduced effort.
12. Customer growth
Customer growth can be assessed and measured many ways and helps businesses understand their success in attracting new customers. One method is to count customers or subscribers at the end of a time period divided by the number of customers or subscribers at the beginning of that time period. Monthly data is typically used.
Options include:
Customer growth =
[Number of customers at end of time period] / [Number of customers at beginning of time period] * 100
New customer growth rate =
[New customers this month] / [Total customers last month] * 100
Net growth =
[Total customers this month] / [Total customers last month] – 1 * 100
Other methods to assess customer growth can include revenue generation, conversion rates, cost per lead, cost per customer acquisition, retention, active users and churn rate.
Role of training for customer success metrics
Training is a great way to empower customers, answer customer inquiries, resolve customer issues and increase customer success.
LEAi is our online learning content development tool, and it helps to quickly create learning content for online courses, step-by-step execution guides, product training, presentations, microlearning, videos, instructor-led training and more. Key features and benefits of LEAi include:
- Import documents, blogs and other content that already exists in your organization to automatically create learning objectives and learning content
- Be guided by best practices with our LearnAdvisor
- Automatically create test questions based on the content
- Repurpose content easily for different learning formats
- Create short and punchy microlearning courses with a click of a button
Don’t have the time or staff to kickstart or grow your training program? No problem. LearnExperts also offers consulting services that will help you scale the development of learning content so you can quickly engage with employees, partners and customers.
To learn more about how we can support your customer success metrics and strategy, contact us!


